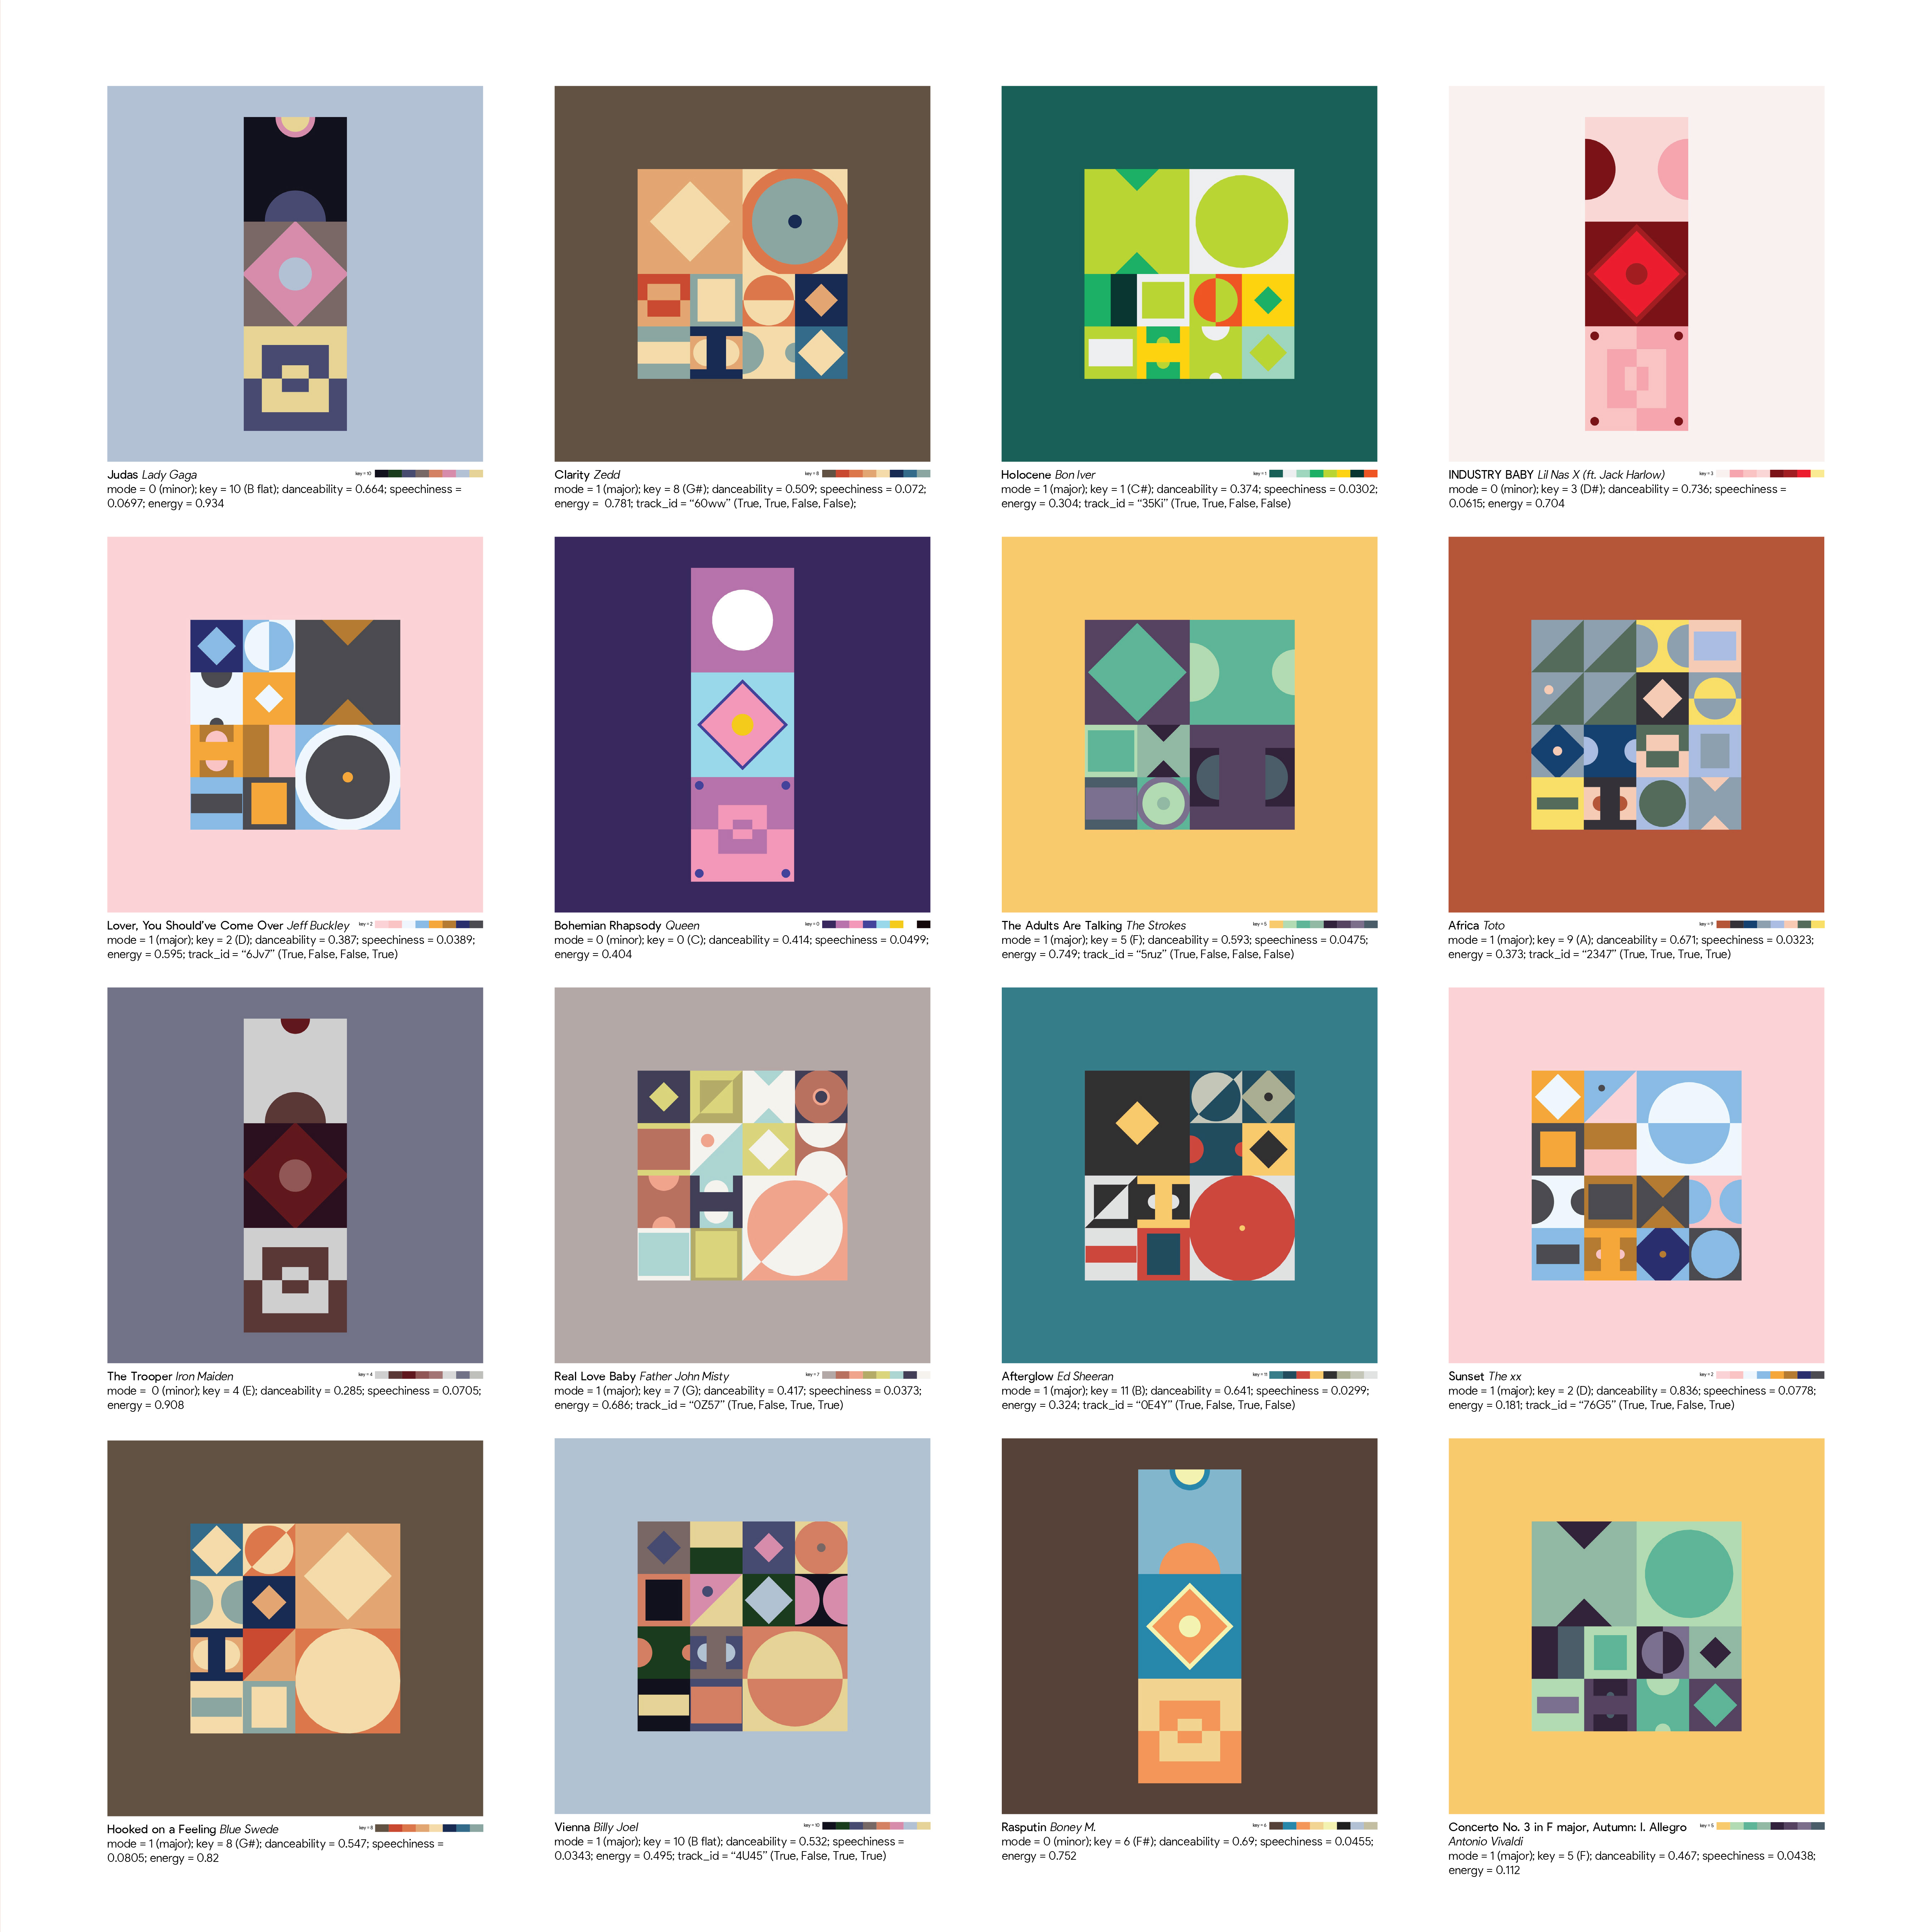
(Geo) Musical Configurations
Inspired by Christina Eve, an artist who has a neurological condition called synesthesia that allows her to see colors and shapes when she hears music, I wanted to create a system that produces geometric compsitions for different songs depending on their musical qualities. Various configurations of two-dimensional, nested geometric shapes are created by extracting Big Data from Spotify using Spotipy, a Python library and translated with a custom Virtual Studio and Grasshopper workflow.
Typology: Generative Art
Timeline: Fall 2021 | Computer Applications in Architecture
Instructor: Sarah Hammond
Collaborators: Individual Work
Timeline: Fall 2021 | Computer Applications in Architecture
Instructor: Sarah Hammond
Collaborators: Individual Work
Strategy
1. Extract musical data
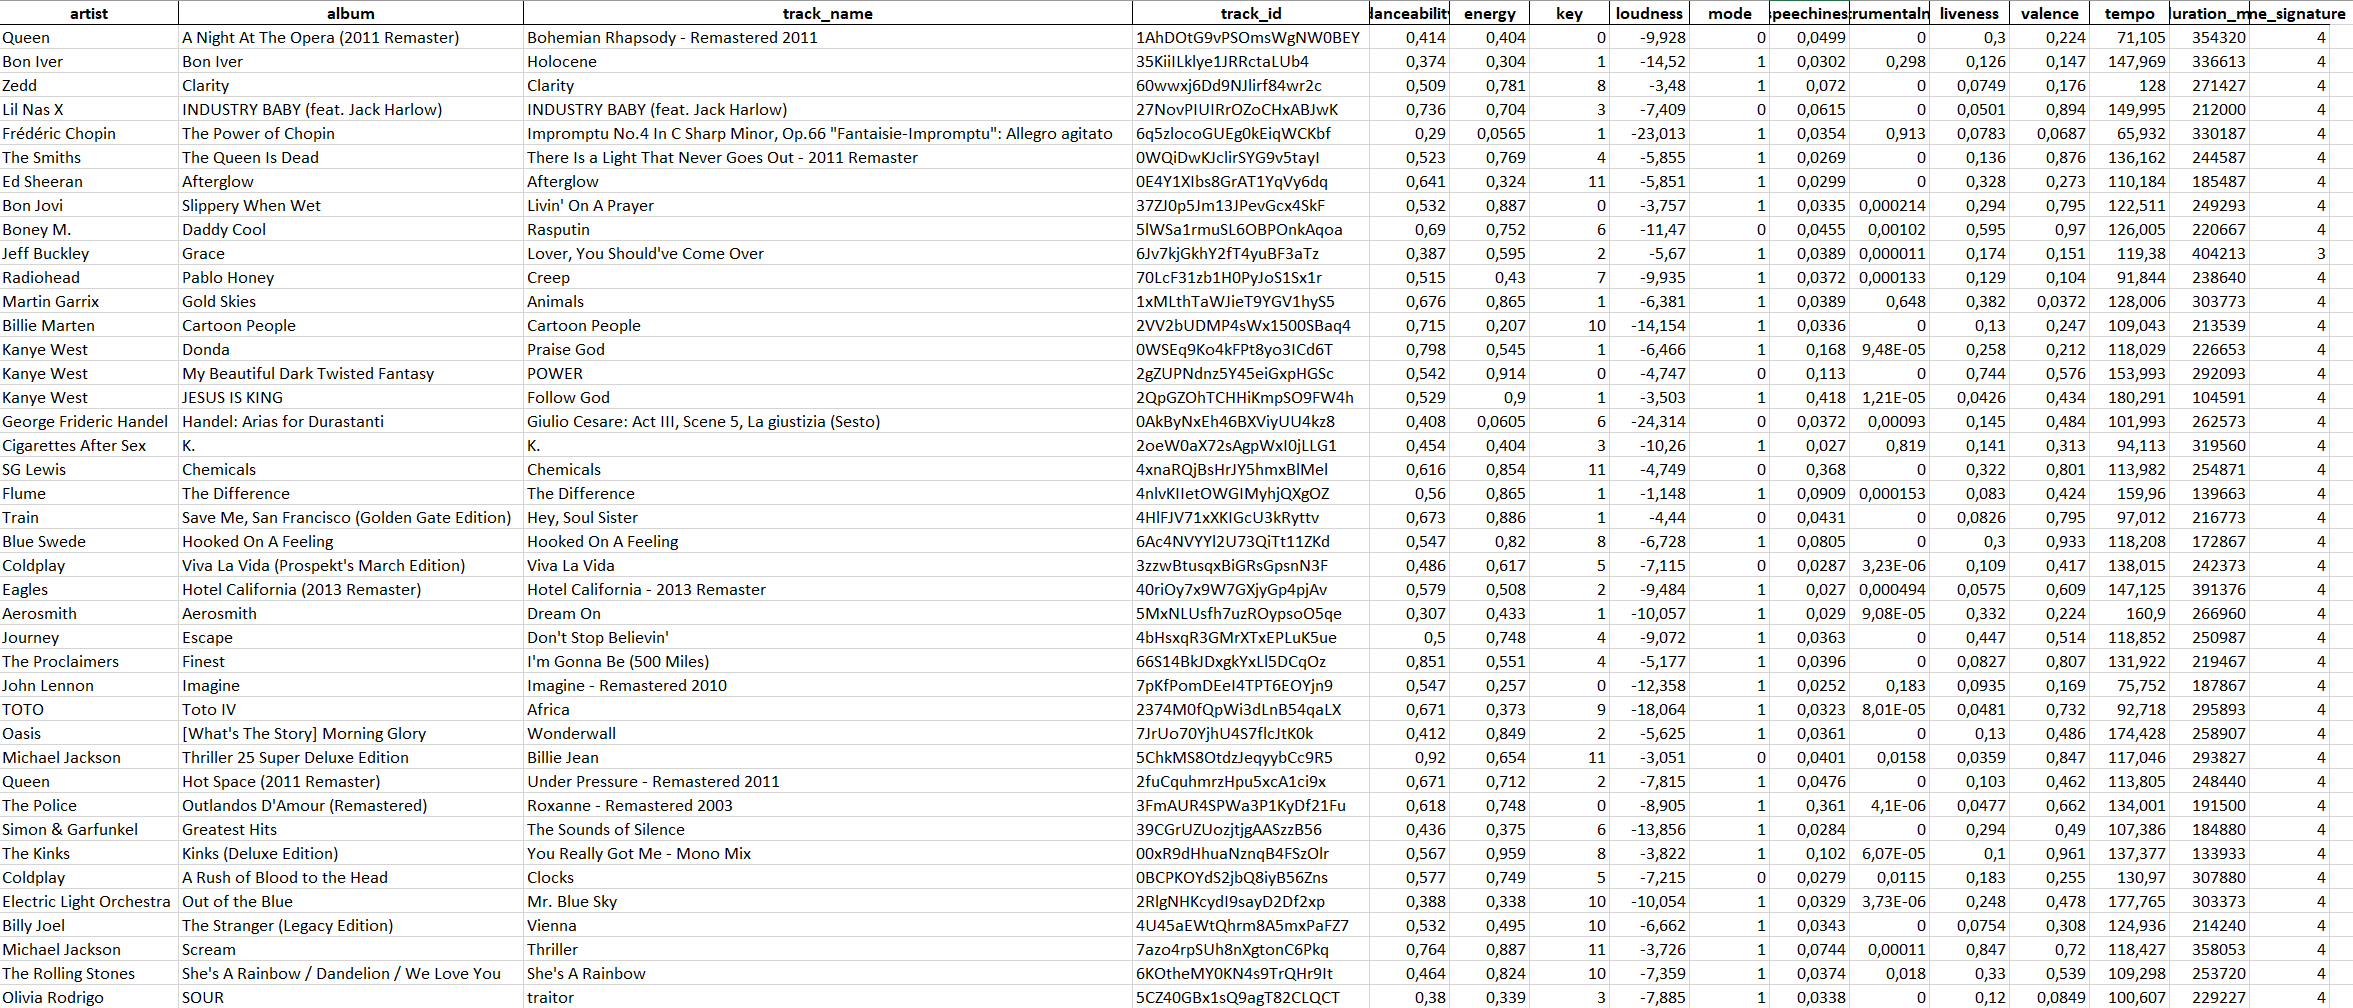
Using Spotipy, a lightweight Python library, I was able to extract musical data of songs in a playlist I created.
from spotipy.oauth2 import SpotifyClientCredentials
import spotipy
import json
import pandas as pd
import csv
client_credentials_manager = SpotifyClientCredentials(“975de7f59a264458ad2c25528a4fe9e9”, “156fa188909549c4bea2a928598c70e5” )
sp = spotipy.Spotify(client_credentials_manager=client_credentials_manager)
pd.set_option(‘display.max_columns’, None)
pd.set_option(‘display.max_rows’, None)
def analyze_playlist(creator, playlist_id)
# Create empty dataframe
playlist_features_list = [“artist”,”album”,”track_name”, “track_id”,”danceability”,”energy”,”key”,”loudness”,”mode”, “speechiness”,”instrumentalness”,”liveness”,”valence”,”tempo”, “duration_ms”,”time_signature”]
playlist_df = pd.DataFrame(columns = playlist_features_list)
# Loop through every track in the playlist, extract features and append the features to the playlist df
playlist = sp.user_playlist_tracks(creator, playlist_id)[“items”]
for track in playlist:
# Create empty dict
playlist_features = {}
# Get metadata
playlist_features[“artist”] = track[“track”][“album”][“artists”][0][“name”]
playlist_features[“album”] = track[“track”][“album”][“name”]
playlist_features[“track_name”] = track[“track”][“name”]
playlist_features[“track_id”] = track[“track”][“id”]
# Get audio features
audio_features = sp.audio_features(playlist_features[“track_id”])[0]
for feature in playlist_features_list[4:]:
playlist_features[feature] = audio_features[feature]
# Concat the dfs
track_df = pd.DataFrame(playlist_features, index = [0])
playlist_df = pd.concat([playlist_df, track_df], ignore_index = True)
return playlist_df
playlist_df = analyze_playlist(“Samantha Shanne”, “1pNdFDi8sNl1La2MUcoXQM”)
playlist_df.head()
playlist_df.to_excel(“more_songs_dataframe_3.xlsx”, index = False)
Output of Parsed Musical Data![asdfasfasdf]()
import spotipy
import json
import pandas as pd
import csv
client_credentials_manager = SpotifyClientCredentials(“975de7f59a264458ad2c25528a4fe9e9”, “156fa188909549c4bea2a928598c70e5” )
sp = spotipy.Spotify(client_credentials_manager=client_credentials_manager)
pd.set_option(‘display.max_columns’, None)
pd.set_option(‘display.max_rows’, None)
def analyze_playlist(creator, playlist_id)
# Create empty dataframe
playlist_features_list = [“artist”,”album”,”track_name”, “track_id”,”danceability”,”energy”,”key”,”loudness”,”mode”, “speechiness”,”instrumentalness”,”liveness”,”valence”,”tempo”, “duration_ms”,”time_signature”]
playlist_df = pd.DataFrame(columns = playlist_features_list)
# Loop through every track in the playlist, extract features and append the features to the playlist df
playlist = sp.user_playlist_tracks(creator, playlist_id)[“items”]
for track in playlist:
# Create empty dict
playlist_features = {}
# Get metadata
playlist_features[“artist”] = track[“track”][“album”][“artists”][0][“name”]
playlist_features[“album”] = track[“track”][“album”][“name”]
playlist_features[“track_name”] = track[“track”][“name”]
playlist_features[“track_id”] = track[“track”][“id”]
# Get audio features
audio_features = sp.audio_features(playlist_features[“track_id”])[0]
for feature in playlist_features_list[4:]:
playlist_features[feature] = audio_features[feature]
# Concat the dfs
track_df = pd.DataFrame(playlist_features, index = [0])
playlist_df = pd.concat([playlist_df, track_df], ignore_index = True)
return playlist_df
playlist_df = analyze_playlist(“Samantha Shanne”, “1pNdFDi8sNl1La2MUcoXQM”)
playlist_df.head()
playlist_df.to_excel(“more_songs_dataframe_3.xlsx”, index = False)
Output of Parsed Musical Data
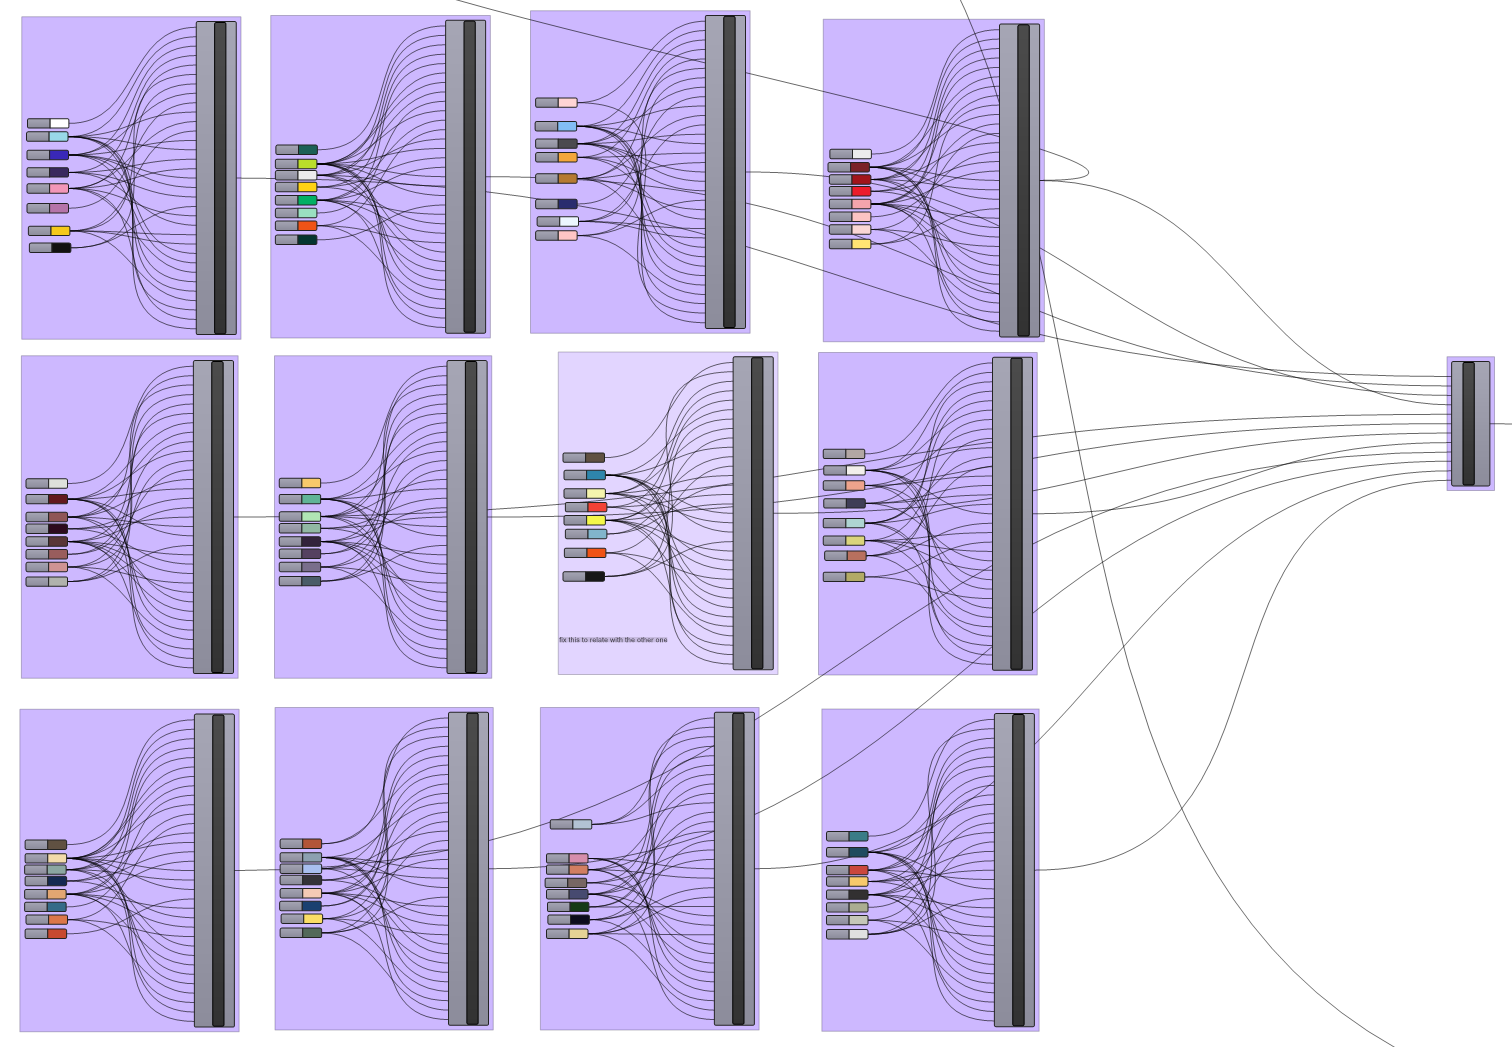
2. Data Parsing & Design Parameters
Mode = Composition

Design Parameter
If mode = 0 → Rectangular composition
if mode ≠ 0 → Square composition
If mode = 0 → Rectangular composition
if mode ≠ 0 → Square composition
From Spotify for Developer Docs
![]()

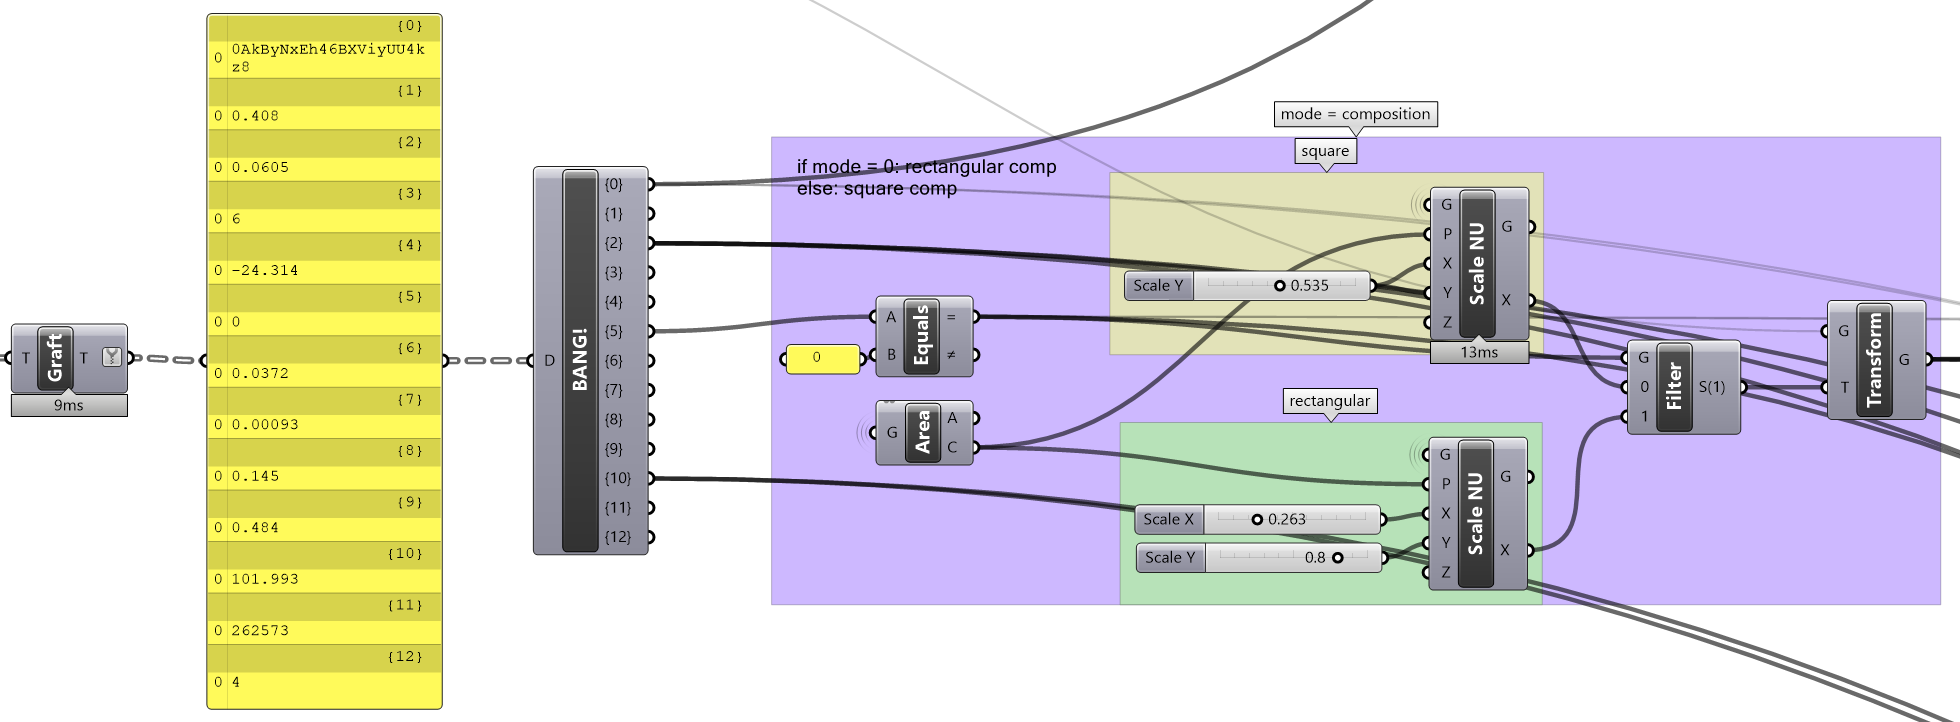

Holocene, Bon Iver
mode ≠ 0 (major key → square composition)

Bohemian Rhapsody, Queen
mode = 0 (minor key → rectangular composition)
track_id = Square subdivision

Design Parameter
Python code evaluates the first four characters of track_id;
prints True if character is an integer
Python code evaluates the first four characters of track_id;
prints True if character is an integer
import rhinoscriptsyntax as rs
first_four_char = x[0:4]
print(first_four_char)
def evaluate(word):
for i in word:
try:
i = int(i)
a = True
print(a)
except:
a = False
print(a)
word = first_four_char
evaluate(word)
first_four_char = x[0:4]
print(first_four_char)
def evaluate(word):
for i in word:
try:
i = int(i)
a = True
print(a)
except:
a = False
print(a)
word = first_four_char
evaluate(word)

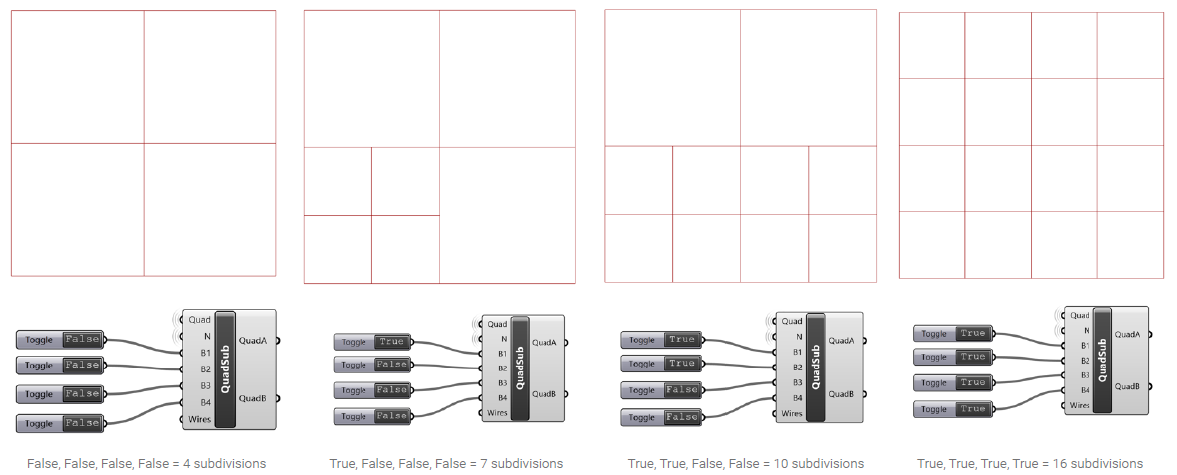

The Adults are Talking The Strokes
track_id = 5ruz (True, False, False, False) = 7 subdivisions

Sunset The xx
track_id = 76G5 (True, True, False, True) = 13 subdivisions
Other Design Parameters
loudness = scale in x-direction
tempo = scale in y-direction
loudness = scale in x-direction
tempo = scale in y-direction
From Spotify for Developer Docs![]()

From Spotify for Developer Docs
![]()


instrumentalness > 0 → move polygons and add circle
instrumentalness = 0 → do nothing, only scale
From Spotify for Developer Docs![]()


Key = Pre-determined Color Scheme

0 (C)
1 (C#)
2 (D)
3 (D#)
4 (E)
5 (F)
6 (F#)
7 (G)
8 (G#)
9 (A)
10 (B flat)
11 (B)
1 (C#)
2 (D)
3 (D#)
4 (E)
5 (F)
6 (F#)
7 (G)
8 (G#)
9 (A)
10 (B flat)
11 (B)

From Spotify for Developer Docs![]()

Final Output
![]() Lover, Y Jeff Buckley
Lover, Y Jeff Buckley
mode = 1 (major); key = 2 (D); danceability = 0.387; speechiness = 0.0389;
energy = 0.595; track_id = “6Jv7” (True, False, False, True)
![]()
 Lover, Y Jeff Buckley
mode = 1 (major); key = 2 (D); danceability = 0.387; speechiness = 0.0389;
energy = 0.595; track_id = “6Jv7” (True, False, False, True)

Real Love Baby Father John Misty
mode = 1 (major); key = 7 (G); danceability = 0.417; speechiness = 0.0373;
energy = 0.686; track_id = “0Z57” (True, False, True, True)
mode = 1 (major); key = 7 (G); danceability = 0.417; speechiness = 0.0373;
energy = 0.686; track_id = “0Z57” (True, False, True, True)
 Judas Lady Gaga
mode = 0 (minor); key = 10 (B flat); danceability = 0.664; speechiness =
0.0697; energy = 0.934
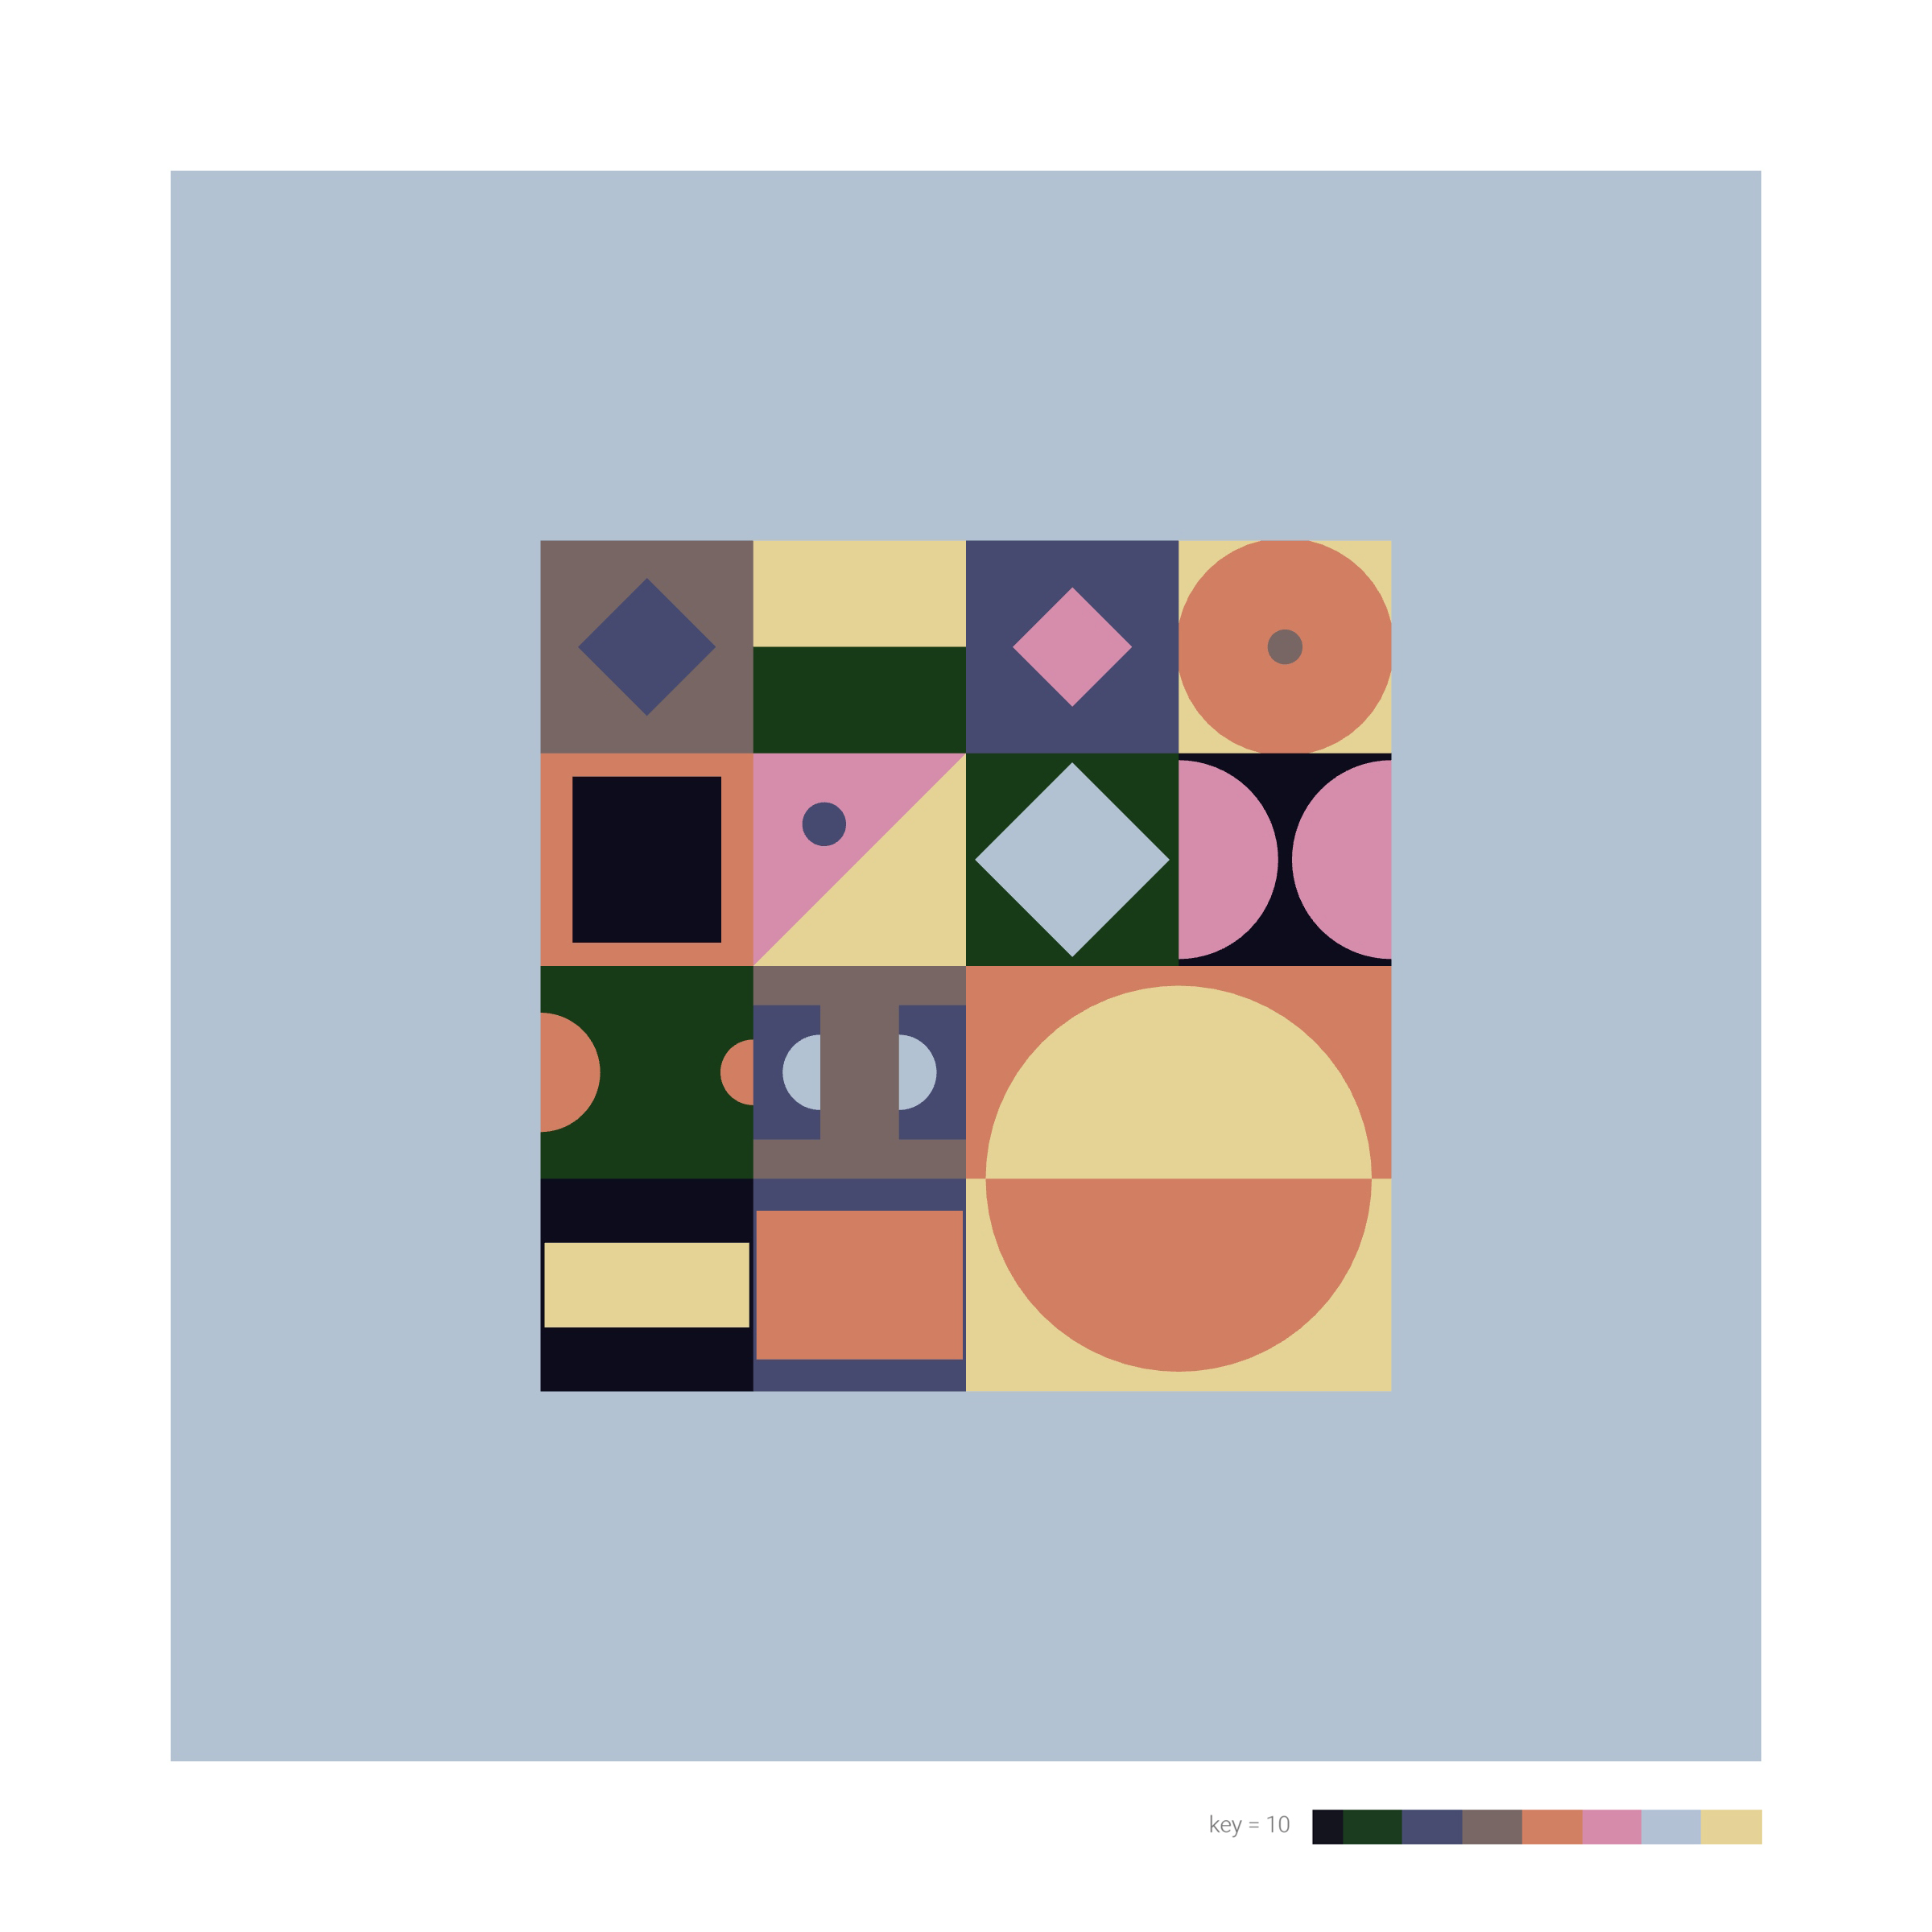
Vienna Billy Joel
mode = 1 (major); key = 10 (B flat); danceability = 0.532; speechiness =
0.0343; energy = 0.495; track_id = “4U45” (True, False, True, True)
mode = 1 (major); key = 10 (B flat); danceability = 0.532; speechiness =
0.0343; energy = 0.495; track_id = “4U45” (True, False, True, True)
